.
After several weeks of counting each and every tiny toadlet in the thousands of pictures taken by our toad tunnel-cam, (and hours of Sofi analyzing all the data), we finally have the results of the 2018 Ryder Lake Toadlet Migration!
This year we recorded over 73,700 toadlets crossing the road safely through our toad tunnel!
We would like to say a big THANK YOU to all our dedicated volunteers, the residents of Ryder Lake, and our project funders for their ongoing support of this project. Thank you especially to everyone who made the effort to use the voluntary detour route during the toadlet migration period. It takes a whole community working together to save a population.
.
You can help us save the Ryder Lake toadlets! Our staff work hard to install toad fencing, maintain detour routes, and monitor the toad populations each year. Make your donation to the Ryder Lake Amphibian Protection Program HERE to help us continue this important work.
To watch a short video about this year’s migration, click HERE
.
Read the details of this year’s migration below!
.
From Tadpoles to Toadlets!
 T
T
.
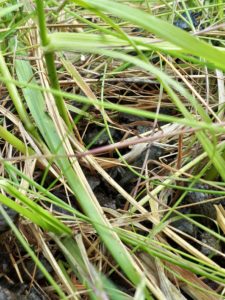
This year’s toadlets were first spotted on land on June 29th, basking in the warm sunshine on the grassy edge of the wetland.
.
Knowing that they had already decided to leave their wetland nursery, we expected these eager toadlets to start hopping towards forest within the next couple of days.
.
This year they seemed content to spend and extended period of time at the water’s edge, perhaps due to some unusual weather conditions. After about a week, they finally started to move along their migration route – across the field and towards the toad tunnel.

.
Toadlets, Get Hopping!
Late in the evening on Wednesday, July 4th, the first stream of migrating toadlets was spotted hopping through the toad tunnel under Elk View Road.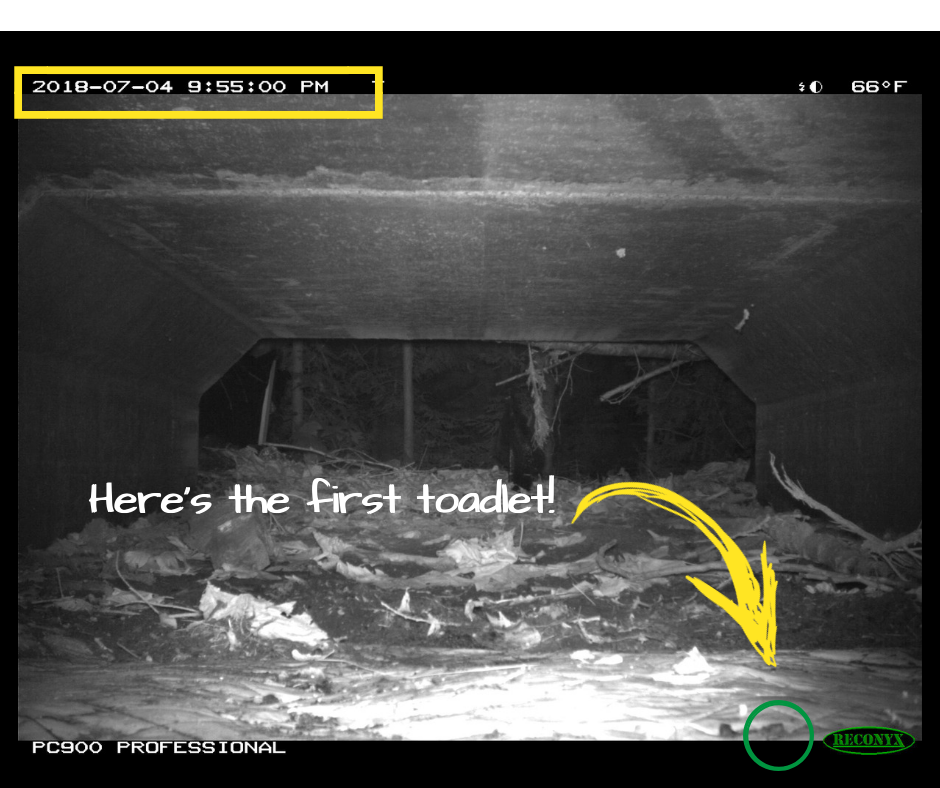
.
Over the next couple of days, there was a dramatic surge in the number of toadlets using the tunnel as more and more toadlets left the wetland to migrate towards their forest homes.
To get an idea of the number of toadlets using the tunnel on a peak migration day, take a look at this video taken on July 10th, which shows this steady stream of tiny toadlets leaving the tunnel and heading towards the forest.
.
.
Herding Toadlets
Through our research over the past five years, we have found that there four main hotspots where toadlets are crossing the roads. The toad tunnel was designed to capture toadlets using one of the most popular migration crossings at Elk View Road.
The majority of this year’s toadlets were directed by the fencing, and crossed under the road safely using the tunnel. We are pleased with how we have been able to improve our directional fencing every year, but we are still finding that some toadlets are not captured by the fencing, and are found on the road.
We have noticed several trends in the pattern of the toadlet migrations over the years. One being that early in the migration period the toadlets are observed crossing Elk View Road near the toad tunnel, whereas later in the migration period they are found crossing further up the road. Toadlets crossing the road further up the hill are not being captured by the directional fencing. In our surveys, we found that many toadlets attempting to migrate in this area were killed on the road before they had a chance to make it to the forest on the other side.
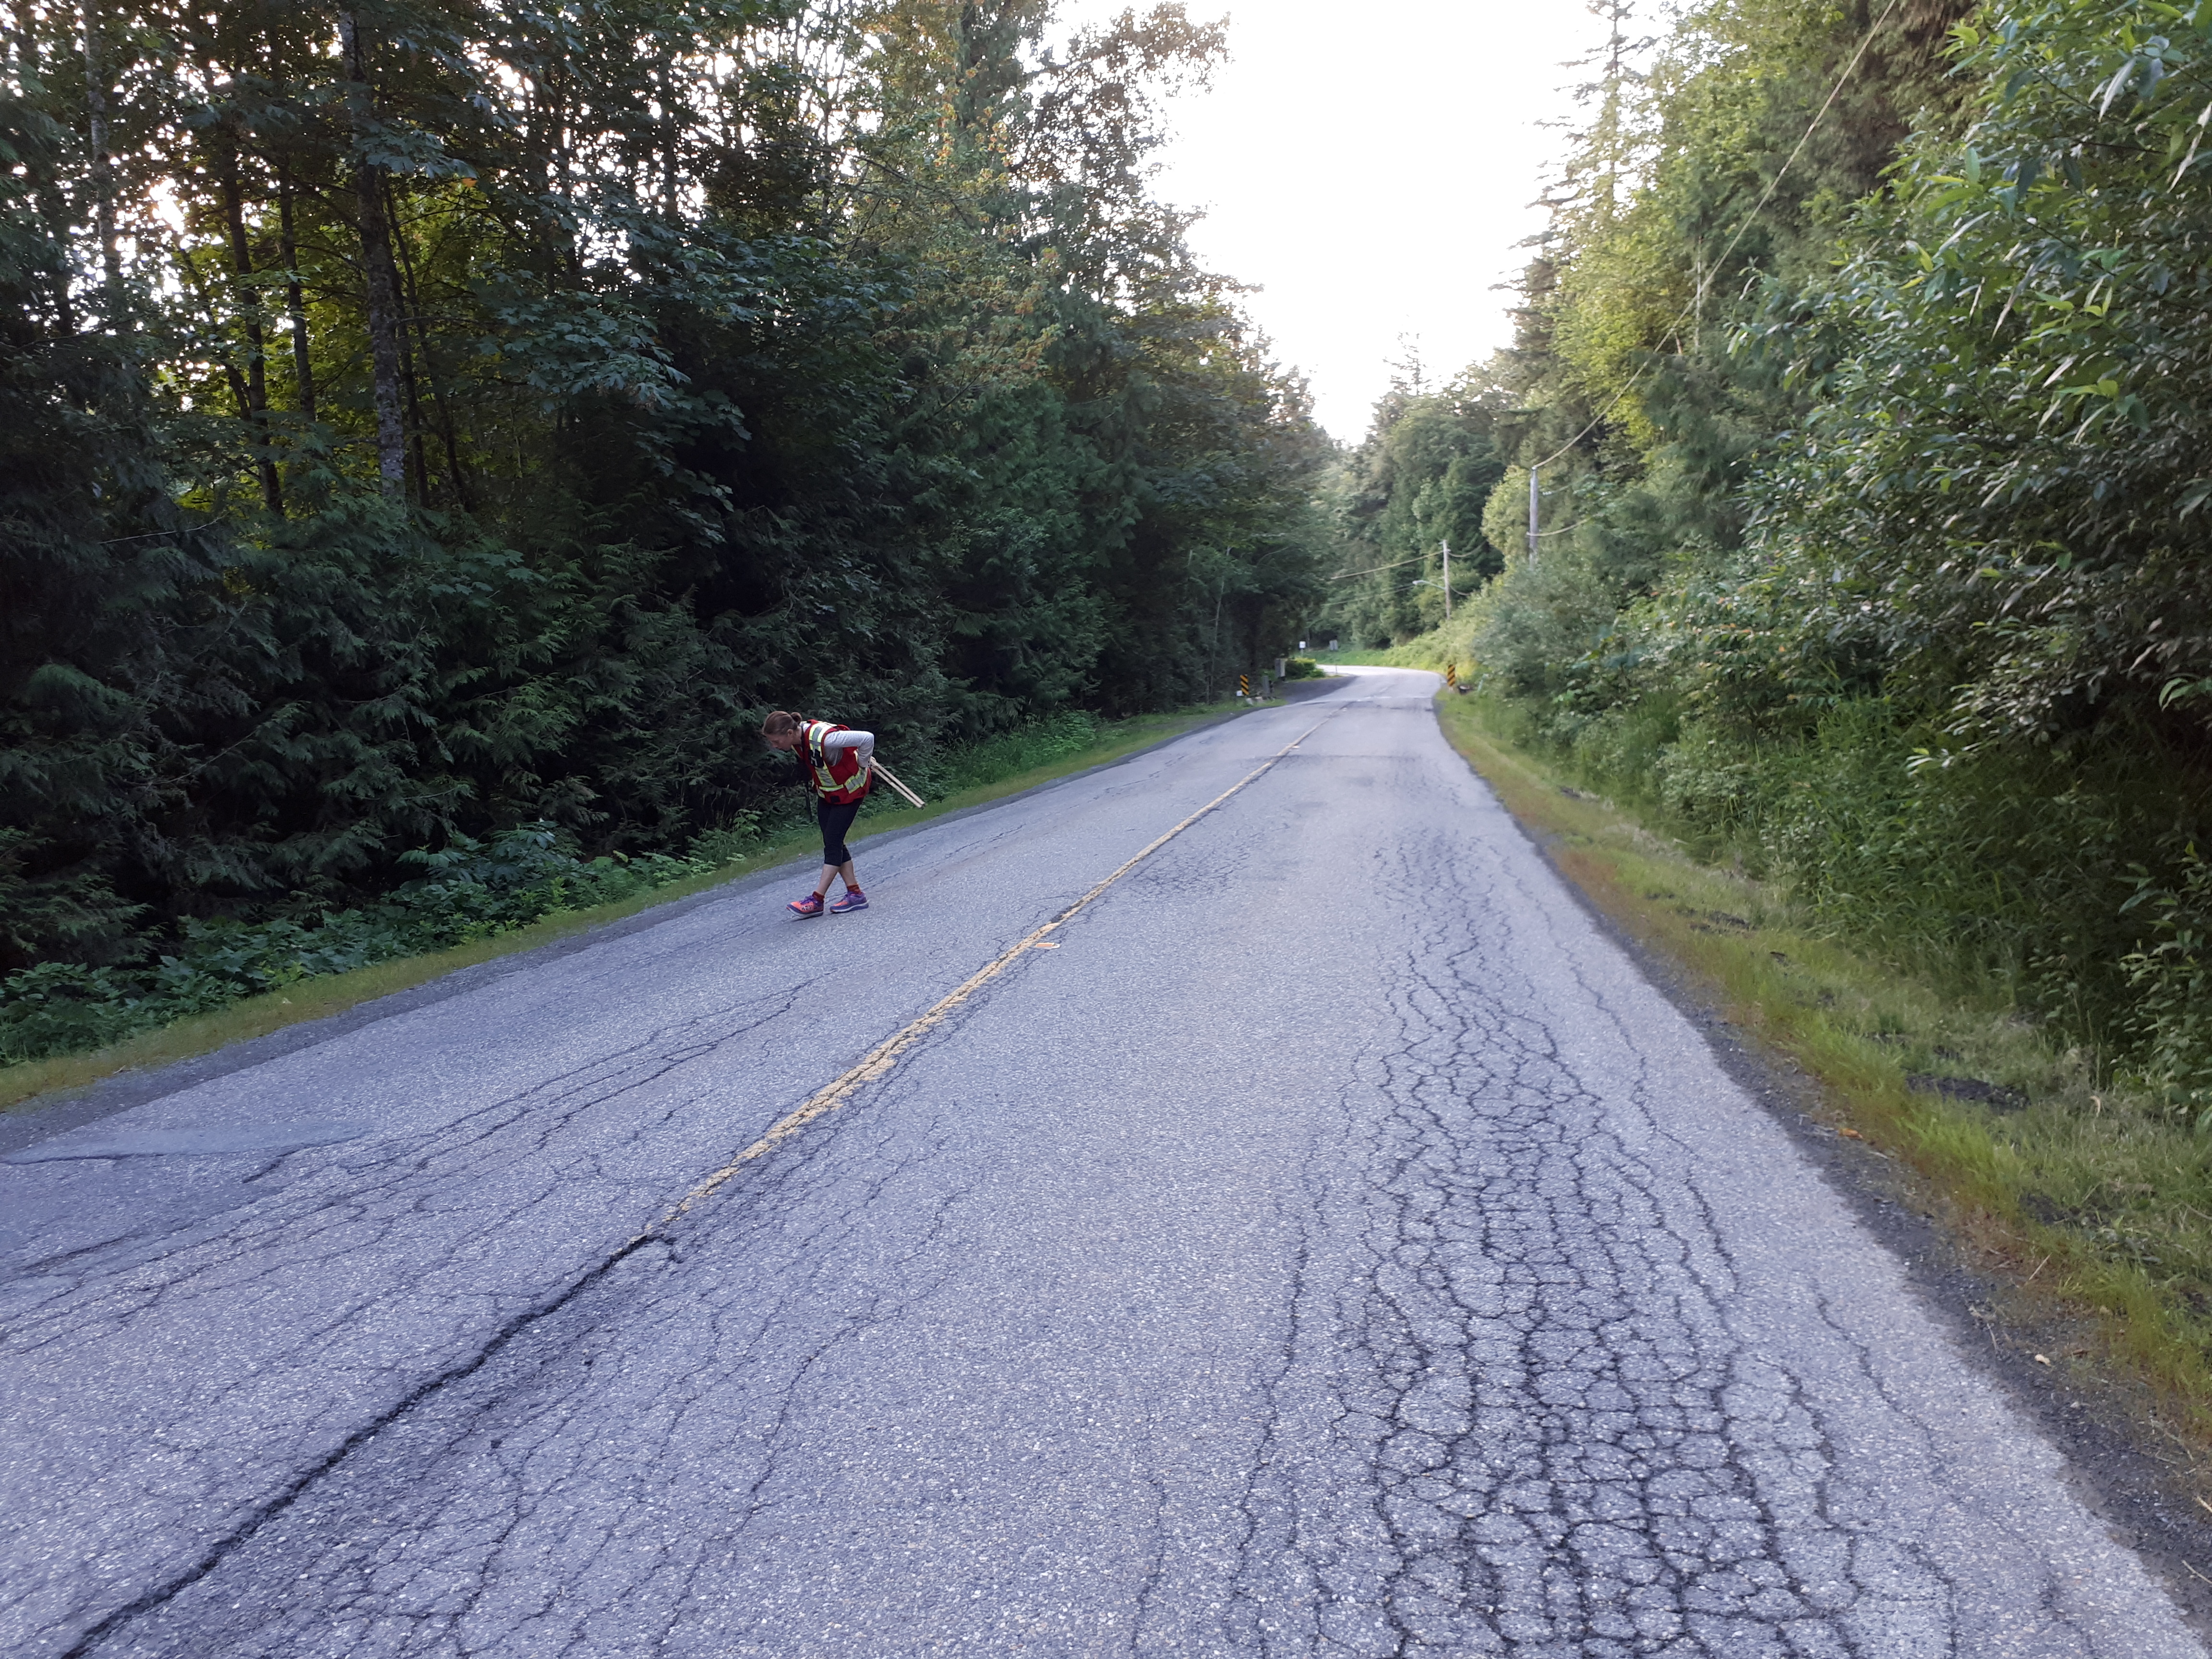
Sofi checking road plots for toadlets
.
The dynamic nature of the toadlet migration means that the traffic detour during toadlet migration season remains an integral component for the success of this project. There will always be some streams of toadlets attempting to cross the roads outside of our directional fencing catchment area.
.
The Final Count
Our tunnel monitoring camera takes a photo every minute during the toadlet migration. This results in over 20,000 photos. We count each toadlet in every one of these pictures to find out how many toadlets are using the tunnel each year. By doing this, we also discover what other kinds of creatures are using our tunnel.
This year we had a total of 73,700 toadlets safely cross the road using the toad tunnel! Last year we only counted 7,425 toadlets (it was an unusual year, read about it HERE), and in 2016 we counted 30,000 toadlets using the tunnel. This year represents a new record high since we started using this monitoring technique! This number aligned with our expectation for the season, as we had witnessed many adult toads migrating to the wetland to breed during our road surveys earlier that spring.
.
What We Learned
We monitor the effectiveness of the tunnel in reducing road mortality by setting up survey plots along Ryder Lake and Elk View Roads. Throughout the migration, staff regularly survey the plots to count how many toadlets are found on the road, alive and dead. This data is later compared to data collected inprevious years , including pre-tunnel data, to asses the effectiveness of the tunnel and directional fencing.
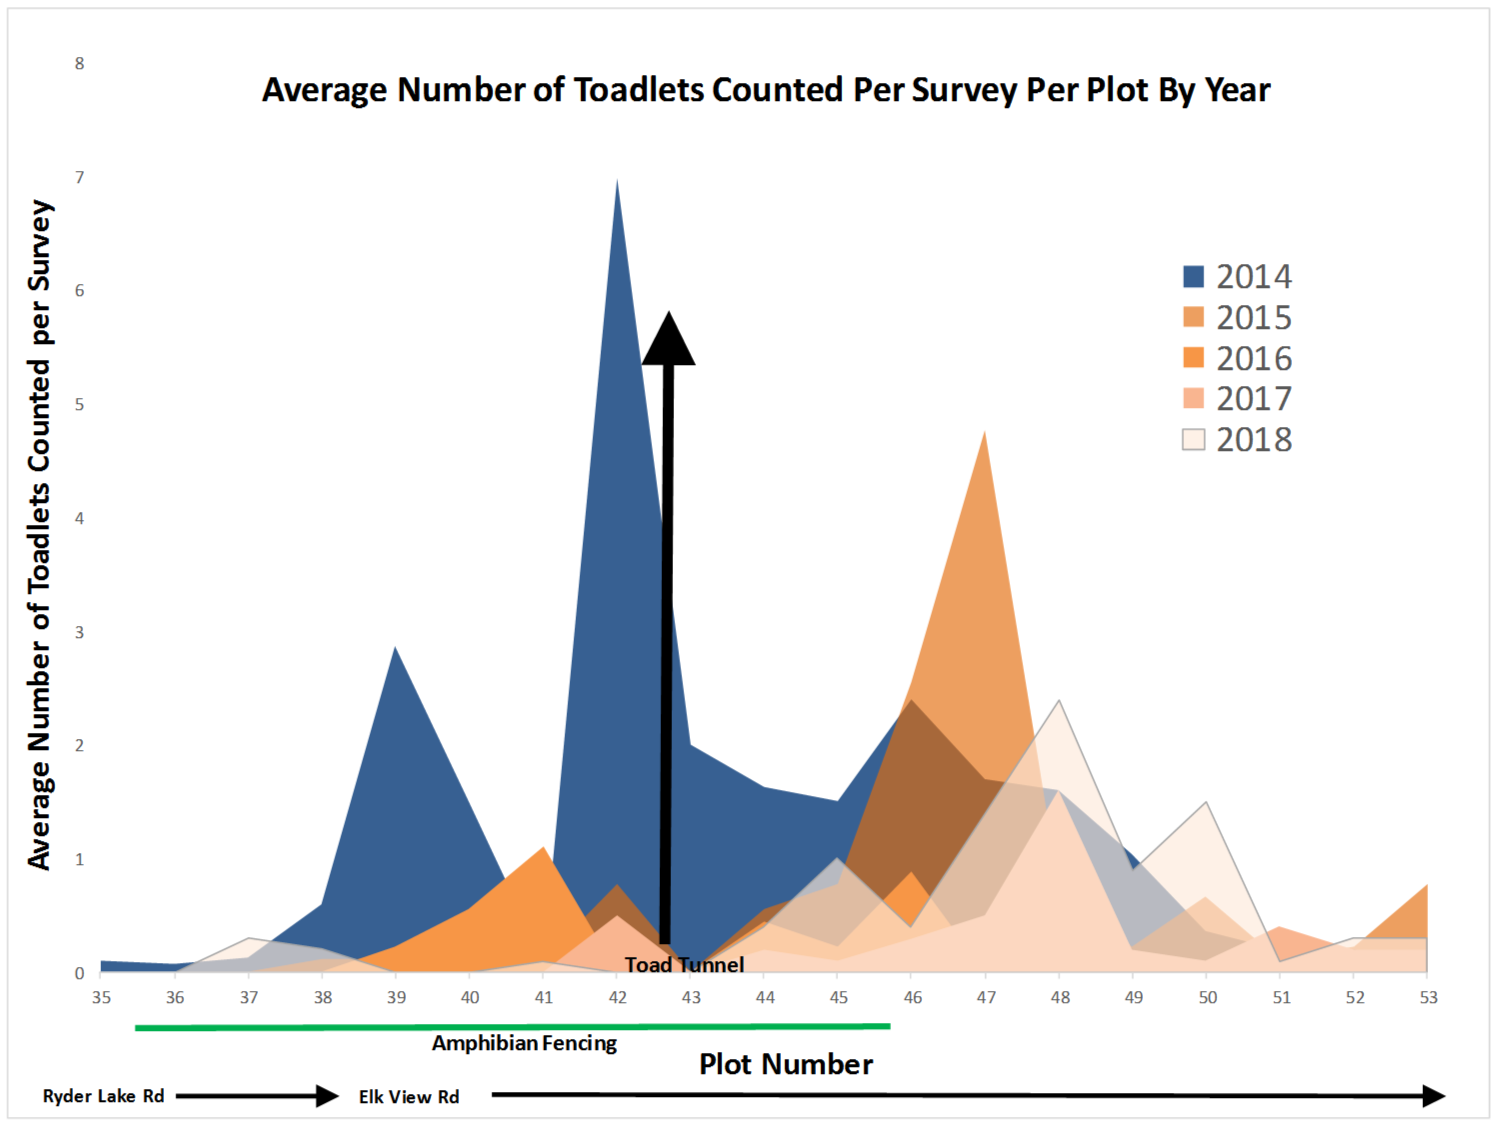
The graph below depicts the numbers of toadlets counted in the plots along Ryder Lake and Elk View Roads. Specifically, it compares the average number of toadlets found dead or alive in each road plot for each year from 2014 (pre-tunnel) to 2018.
.
As indicated by the graph above, we compare the average number of toads found on the road during the pre-tunnel 2014 toadlet migration (dark blue), with data collected in the years following the installation from 2015 to 2018 (orange shades). It shows that the number of toads found on the road at plot 43 (where the toad tunnel is located) has decreased. This is important because it tells us that fewer toadlets are crossing the road at this plot; we can infer that they are likely using the toad tunnel instead.
The green line on this graph indicates the area in which directional fencing has been installed to direct the toadlets toward a safe crossing structure. We can see that there continues to be a reduction in the numbers of toadlets found on the road along this stretch from 2015 onwards.
Spikes in the graph occurring at plots outside of the directional fencing catchment (plots 47-53) correspond to the numbers of toadlets we observe crossing the road past the tunnel, further up the hill on Elk View Road. We are engaged with the City of Chilliwack in the hopes of creating safer crossings, and associated fencing, for toadlets in these areas.
.
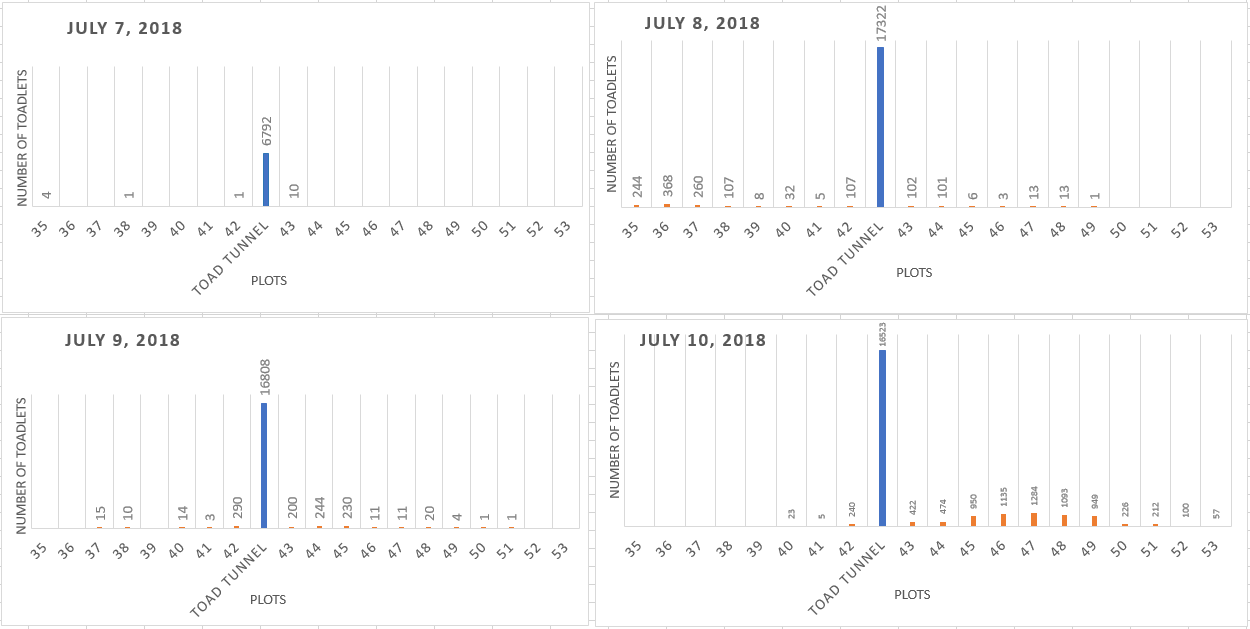
New for this year, we created the graphs below. These graphs depict the number toadlet mortalities we observed on the road (orange bars) as compared to the number of toadlets travelling through the tunnel (blue bars), on a daily basis during peak migration dates.
Number of Toadlets Found on the Road or in the Tunnel on a Given Day
.
It is encouraging to look at the data in this way. It helps us see that a large proportion of toadlets were making it safely across the road by using the tunnel, as compared to the number that died in their attempt to cross the road.
Interestingly, this year we did not observe any toadlets across Houston Road as we have in other years.
.
Toadlet Fame!
The Ryder Lake toadlets received a lot of media attention this year. Hiking groups and websites posted information about our detour, newspapers wrote articles about the mass migration, and people stopped us at community events to ask how the toadlets were doing. Media articles written about this project included:
.
Once again, we would like to give a big thank you to the community of Ryder Lake for supporting and embracing this project, and also to our dedicated survey volunteers for helping us with this important work.
.